Creating Augmented Reality Fitness Task Cards
 arget can be a picture, poster, real-life object or many other things. The overlay can be a URL, 3-D object, audio, video, or various other sources of media. This poster is the newest target I’ve designed. This target was made using Comic Life.Below is a screencast where I discuss making a target with a slideshow overlay for students. I plan to give students different targets throughout the year as well as edit the targets they have already received to give them new physical activity challenges. I know many of my students will choose to use their mobile devices at home so I hope this will give them an opportunity to be physically active while they do so.I created this AR target in the program DAQRI. One of many things you can create in DAQRI is a slideshow like the one displayed in the screencast. Each slide can stay on the screen for as little as 1 second or as long as 10 seconds. You can also move to the next slide by swiping your finger across the screen of your mobile device. DAQRI also allows you to play MP3 files within your target which is also demonstrated in the screencast. I recommend that you download the DAQRI app and try out the target I’ve included in this post. You can scan the target directly from your computer or mobile device using a second device. Another option is to print out the target and then scan it. I will be back soon with more possibilities for using augmented reality in a Physical Education setting and to help increase physical activity outside of school.Find me on Twitter if you have any questions: @collinbrooksie
Analyzing Race, Gender and Skill Level Interaction in Physical Education
For part two of this blog series on systematic observation I would like to share a verbal interaction form. This form was adapted from one I received from Dr. Hans van Der Mars and is a great way to track how often you interact with students with different skill levels, different genders and different races. As you know, it is pivotal to give every student an equal physical education and this form will help give you an honest look at your interactions with all your students.
As discussed in part one of this blog series I recommend that you wear a wireless microphone and find an administrator or colleague to record you. Make sure for this specific systematic observation that the camera follows you wherever you go. Also make sure that you can hear your interactions with students so you can note what was said.
Once you video the specific class you desire to gain information from, copy and use the Google Sheet or download to Excel and begin filling in your students’ names. Secondly, add each student’s gender, skill level and ethnicity to the corresponding columns next to the their name. As a side note, you need to have some baseline data of your students’ capabilities as a learner before using his form. Thirdly, watch your lesson video carefully and record each interaction you have with a student. At the end of the video total the number of interactions with each individual student and enter it into the spreadsheet.
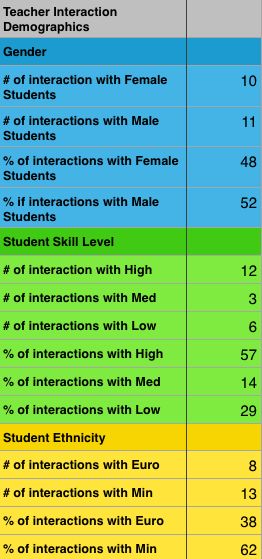 In the interest in time I created a spreadsheet that would do the majority of the work for you. Once you have recorded your interactions on the spreadsheet the data will be automatically analyzed thanks to the spreadsheet wizard (my wife). You can find the analysis broken down into percentages on the second spreadsheet. The following group demographic percentages are included: percentage of male students and female students, percentage of high, medium and low skilled students, and percentage of student ethnicities.
The following teacher interaction percentages are also included: percentage of interactions with males students and female students, percentage of interaction with high, medium and low skilled students and percentage of interaction with students of different races. The teacher interaction percentages are the most important information to pay attention to. This is a great way to track whether or not you are meeting the needs of every student within your class.
Specific Spreadsheet Instructions
Follow these specific instructions in order for the spreadsheet formulas to work correctly: After you enter the students names make sure that you mark “M” for male and “F” for female in the gender column.
For the student demographics and student race make sure to mark an “X” in the appropriate cells. For teacher interactions put the total number of interactions you have of each student within the cell. For example if you have 3 interactions with one student mark this cell with a 3. Finally, feel free to change the racial groups in the spreadsheet. This is set up for Bend, Oregon, which is a lot different than other regions of the country and world. However, this spreadsheet is only designed to track two different group categories. If you want to add more, the formulas in the Percentage Analysis tab will need to be adjusted.
Connect with me on Twitter (@collinbrooksie) with any questions about teacher interactions. For more on systematic observation read part one of the series here.
Using Augmented Reality to Increase Physical Activity Outside of School
Augmented reality, or AR, opens the door for various possibilities in a Physical Education/physical activity setting. Augmented reality works similar to a QR code, but instead of a QR code you have a target. A target can be a picture or even a real-life object. Once the target is activated it can overlay an object onto your screen, take you to an URL and much more. A great example of how the overlay works is Anatomy 4D. To see how the URL feature works, watch the following video, which briefly demonstrates one way AR can be used to increase physical activity outside of school. Request an invite for a AR account through DAQRI here.
Find me on Twitter if you have any questions: @collinbrooksie
