Analyzing Race, Gender and Skill Level Interaction in Physical Education
For part two of this blog series on systematic observation I would like to share a verbal interaction form. This form was adapted from one I received from Dr. Hans van Der Mars and is a great way to track how often you interact with students with different skill levels, different genders and different races. As you know, it is pivotal to give every student an equal physical education and this form will help give you an honest look at your interactions with all your students.
As discussed in part one of this blog series I recommend that you wear a wireless microphone and find an administrator or colleague to record you. Make sure for this specific systematic observation that the camera follows you wherever you go. Also make sure that you can hear your interactions with students so you can note what was said.
Once you video the specific class you desire to gain information from, copy and use the Google Sheet or download to Excel and begin filling in your students’ names. Secondly, add each student’s gender, skill level and ethnicity to the corresponding columns next to the their name. As a side note, you need to have some baseline data of your students’ capabilities as a learner before using his form. Thirdly, watch your lesson video carefully and record each interaction you have with a student. At the end of the video total the number of interactions with each individual student and enter it into the spreadsheet.
 In the interest in time I created a spreadsheet that would do the majority of the work for you. Once you have recorded your interactions on the spreadsheet the data will be automatically analyzed thanks to the spreadsheet wizard (my wife). You can find the analysis broken down into percentages on the second spreadsheet. The following group demographic percentages are included: percentage of male students and female students, percentage of high, medium and low skilled students, and percentage of student ethnicities.
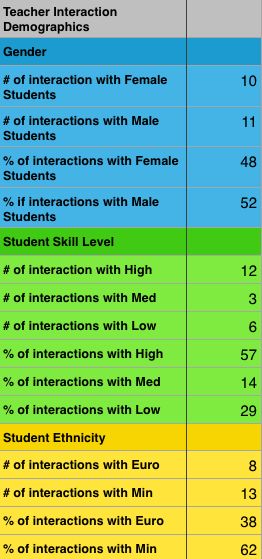
The following teacher interaction percentages are also included: percentage of interactions with males students and female students, percentage of interaction with high, medium and low skilled students and percentage of interaction with students of different races. The teacher interaction percentages are the most important information to pay attention to. This is a great way to track whether or not you are meeting the needs of every student within your class.
Specific Spreadsheet Instructions
Follow these specific instructions in order for the spreadsheet formulas to work correctly: After you enter the students names make sure that you mark “M” for male and “F” for female in the gender column.
For the student demographics and student race make sure to mark an “X” in the appropriate cells. For teacher interactions put the total number of interactions you have of each student within the cell. For example if you have 3 interactions with one student mark this cell with a 3. Finally, feel free to change the racial groups in the spreadsheet. This is set up for Bend, Oregon, which is a lot different than other regions of the country and world. However, this spreadsheet is only designed to track two different group categories. If you want to add more, the formulas in the Percentage Analysis tab will need to be adjusted.
Connect with me on Twitter (@collinbrooksie) with any questions about teacher interactions. For more on systematic observation read part one of the series here.

Quality content is the crucial to be a focus for
the visitors to go to see the website, that’s what this
web page is providing.
Pingback: Analyzing Teacher Prompting, Questioning Skills and Other Essential Skills | PHYSEDagogy
Pingback: Are You Game Day Ready? | PHYSEDAGOGY
Pingback: Are You Game Day Ready? | PHYSEDAGOGY
Pingback: Are You Game Day Ready? | #Physed Blog Library